DP4ML - Data Transform - Phần 3 - How to Make Distributions More Gaussian

Bài thứ 16 trong chuỗi các bài viết về chủ đề Data Preparation cho các mô hình ML và là bài thứ 3 về về Data Transforms. Trong bài này, chúng ta sẽ tìm hiểu cách thức thực hiện Transforms làm cho phân phối của các features trở nên gần với Gaussian hơn. Chúng ta cũng sẽ thực hành trên bộ dữ liệu thực tế.
1. Make Data More Gaussian
Các thuật toán ML như Linear Regression, Gaussian Naive Bayes giả định các features có phân phối xác suất Gaussian. Trong khi đó, dữ liệu của bạn có thể không có phân phối Gaussian hoặc chỉ gần giống Gaussian do có giá trị outlier. Nếu chúng ta có thể làm cho phân phối của dữ liệu gần với Gaussian hơn thì độ chính xác của mô hình có thể được tăng lên đáng kể. Power Transform như Box-Cox transform và Yeo-Johnson transform, Quantile Transforms như Normal Quantile transform và Uniform Quantile transform là các giải pháp tự động giúp bạn thực hiện các biến đổi này.
1.1 Ví dụ sử dụng Power Transforms trong scikit-learn
Power Transforms được cung cấp trong thư viện scikit-learn thông qua lớp PowerTransformer(). Tham số method sẽ chỉ ra phương pháp thực hiện Power Transforms là Box-Cox hay Yeo-Johnson.
# demonstration of the power transform on data with a skew
from numpy import exp
from numpy.random import randn
from sklearn.preprocessing import PowerTransformer
from matplotlib import pyplot
# generate gaussian data sample
data = randn(1000)
# add a skew to the data distribution
data = exp(data)
# histogram of the raw data with a skew
pyplot.hist(data, bins=25)
pyplot.show()
# reshape data to have rows and columns
data = data.reshape((len(data),1))
# power transform the raw data
power = PowerTransformer(method='yeo-johnson', standardize=True)
data_trans = power.fit_transform(data)
# histogram of the transformed data
pyplot.hist(data_trans, bins=25)
pyplot.show()
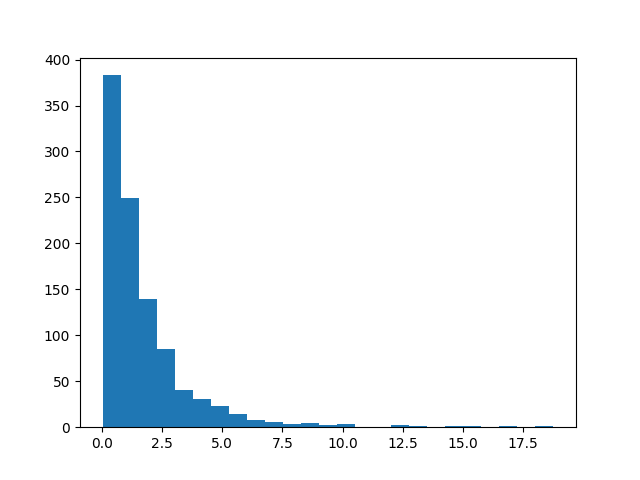
- Phân phối dữ liệu ban đầu:
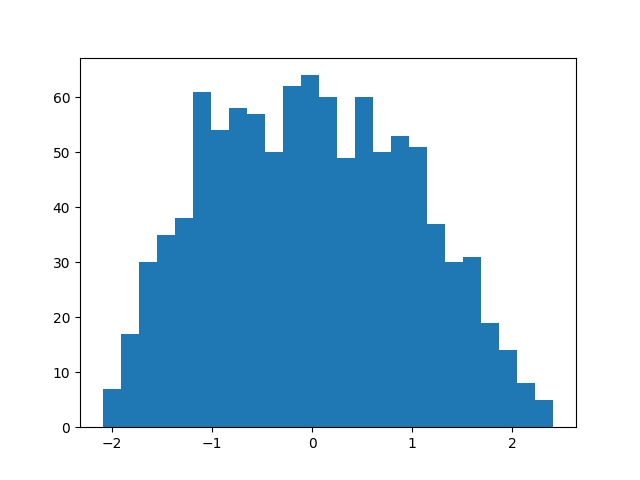
- Phân phối dữ liệu sau khi thực hiện Power Transforms
1.2 Ví dụ sử dụng Quantile Transforms trong scikit-learn
Quantile Transforms được cung cấp trong thư viện scikit-learn thông qua lớp QuantileTransformer(). Tham số output_distribution sẽ chỉ ra phương pháp thực hiện Power Transforms là normal hay uniform. Tham số n_quantiles chỉ ra số lượng quantile sử dụng, nó không được lớn hơn số lượng mẫu trong dataset.
# demonstration of the quantile transform
from numpy import exp
from numpy.random import randn
from sklearn.preprocessing import QuantileTransformer
from matplotlib import pyplot
# generate gaussian data sample
data = randn(1000)
# add a skew to the data distribution
data = exp(data)
# histogram of the raw data with a skew
pyplot.hist(data, bins=25)
pyplot.show()
# reshape data to have rows and columns
data = data.reshape((len(data),1))
# quantile transform the raw data
quantile = QuantileTransformer(output_distribution='normal')
data_trans = quantile.fit_transform(data)
# histogram of the transformed data
pyplot.hist(data_trans, bins=25)
pyplot.show()
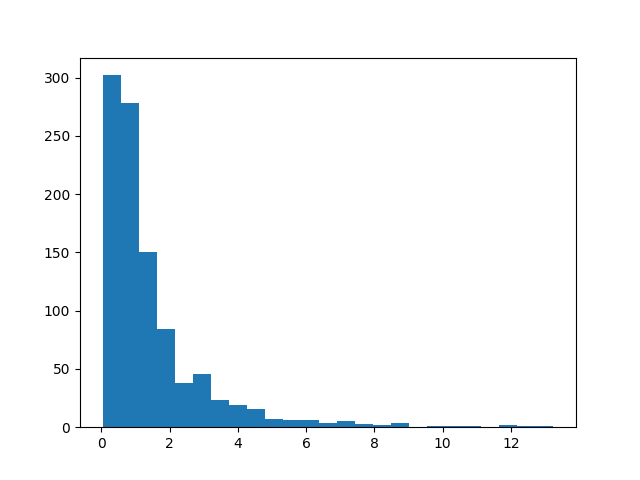
- Phân phối dữ liệu ban đầu
- Phân phối dữ liệu sau khi thực hiện Quantile Transforms

Ta thấy, dữ liệu trước và sau khi thực hiện Transforms đã có sự biến đổi rõ rệt. Dữ liệu ban đầu có phân phối lệch hẳn về bên trái, còn dữ liệu sau có phân phối tương đối Gaussian với mean ~ 0 và std ~ 1.
2. Thực hành Power Transforms
2.1 Sonar Dataset
Sonar Dataset là bộ dữ liệu cho bài toán Binary Classification. Nó gồm 208 mẫu dữ liệu, mỗi mẫu có 60 features và 1 target. Baseline model đạt được độ chính xác là 53.4%. 88% là độ chính xác cao nhất có thể đạt được trên tập dữ liệu này đến hiện tại. Bạn có thể download và tìm hiểu thêm về nó tại đây và tại đây.
Load và kiểm tra thử tập dữ liệu này:
# load and summarize the sonar dataset
from pandas import read_csv
from matplotlib import pyplot
# load dataset
dataset = read_csv('sonar.csv', header=None)
# summarize the shape of the dataset
print(dataset.shape)
# summarize each variable
print(dataset.describe())
# histograms of the variables
fig = dataset.hist(xlabelsize=4, ylabelsize=4)
[x.title.set_size(4) for x in fig.ravel()]
# show the plot
pyplot.show()
Kết quả thực hiện:
(208, 61)
               0           1           2           3           4           5           6           7   ...          52          53          54          55          56          57          58          59
count  208.000000  208.000000  208.000000  208.000000  208.000000  208.000000  208.000000  208.000000  ...  208.000000  208.000000  208.000000  208.000000  208.000000  208.000000  208.000000  208.000000
mean     0.029164    0.038437    0.043832    0.053892    0.075202    0.104570    0.121747    0.134799  ...    0.010709    0.010941    0.009290    0.008222    0.007820    0.007949    0.007941    0.006507
std      0.022991    0.032960    0.038428    0.046528    0.055552    0.059105    0.061788    0.085152  ...    0.007060    0.007301    0.007088    0.005736    0.005785    0.006470    0.006181    0.005031
min      0.001500    0.000600    0.001500    0.005800    0.006700    0.010200    0.003300    0.005500  ...    0.000500    0.001000    0.000600    0.000400    0.000300    0.000300    0.000100    0.000600
25%      0.013350    0.016450    0.018950    0.024375    0.038050    0.067025    0.080900    0.080425  ...    0.005075    0.005375    0.004150    0.004400    0.003700    0.003600    0.003675    0.003100
50%      0.022800    0.030800    0.034300    0.044050    0.062500    0.092150    0.106950    0.112100  ...    0.009550    0.009300    0.007500    0.006850    0.005950    0.005800    0.006400    0.005300
75%      0.035550    0.047950    0.057950    0.064500    0.100275    0.134125    0.154000    0.169600  ...    0.014900    0.014500    0.012100    0.010575    0.010425    0.010350    0.010325    0.008525
max      0.137100    0.233900    0.305900    0.426400    0.401000    0.382300    0.372900    0.459000  ...    0.039000    0.035200    0.044700    0.039400    0.035500    0.044000    0.036400    0.043900

[8 rows x 60 columns]
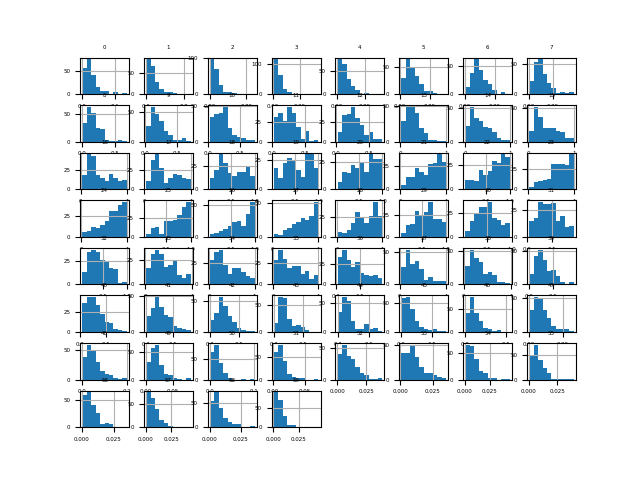
Có thể thấy, hầu hết các phân phối của các features đều bị lệch, không giống với Gaussian.
Thử mô hình hóa tập dữ liệu này bằng thuật toán kNN:
# evaluate knn on the raw sonar dataset
from numpy import mean
from numpy import std
from pandas import read_csv
from sklearn.model_selection import cross_val_score
from sklearn.model_selection import RepeatedStratifiedKFold
from sklearn.neighbors import KNeighborsClassifier
from sklearn.preprocessing import LabelEncoder
# load dataset
dataset = read_csv('sonar.csv', header=None)
data = dataset.values
# separate into input and output columns
X, y = data[:, :-1], data[:, -1]
# ensure inputs are floats and output is an integer label
X = X.astype('float32')
y = LabelEncoder().fit_transform(y.astype('str'))
# define and configure the model
model = KNeighborsClassifier()
# evaluate the model
cv = RepeatedStratifiedKFold(n_splits=10, n_repeats=3, random_state=1)
n_scores = cross_val_score(model, X, y, scoring='accuracy', cv=cv, n_jobs=-1)
# report model performance
print('Accuracy: %.3f (%.3f)' % (mean(n_scores), std(n_scores)))
Kết quả thực hiện:
Accuracy: 0.797 (0.073)
2.2 Box-Cox Transform
Box-Cox transform được đặt theo tên hai tác giả của phương pháp này. Nó chỉ áp dụng cho các giá trị dương.
Bởi vì tập dữ liệu Sonar có chứa giá trị 0 nên không thể sử dụng trực tiếp cho Box-Cox được. Nếu bạn cố tình thực hiện sẽ sinh ra lỗi ValueError: The Box-Cox transformation can only be applied to strictly positive data.
Để giải quyết vấn đề này, ta sử dụng thêm một phép biến đổi normalization với feature_range=(1,2).
# visualize a box-cox transform of the scaled sonar dataset
from pandas import read_csv
from pandas import DataFrame
from sklearn.preprocessing import PowerTransformer
from sklearn.preprocessing import MinMaxScaler
from sklearn.pipeline import Pipeline
from matplotlib import pyplot
# Load dataset
dataset = read_csv('sonar.csv', header=None)
# retrieve just the numeric input values
data = dataset.values[:, :-1]
# perform a box-cox transform of the dataset
scaler = MinMaxScaler(feature_range=(1, 2))
power = PowerTransformer(method='box-cox')
pipeline = Pipeline(steps=[('s', scaler),('p', power)])
data = pipeline.fit_transform(data)
# convert the array back to a dataframe
dataset = DataFrame(data)
# histograms of the variables
fig = dataset.hist(xlabelsize=4, ylabelsize=4)
[x.title.set_size(4) for x in fig.ravel()]
# show the plot
pyplot.show()
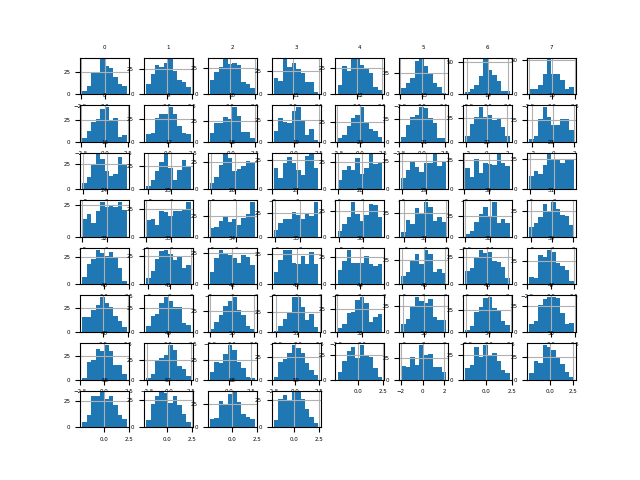
Ta thấy rằng phân phối của các features đã giống Gaussian hơn rất nhiều.
Thử mô hình hóa tập dữ liệu sau khi thực hiện Power Transforms này với thuật toán kNN:
# evaluate knn on the box-cox sonar dataset
from numpy import mean
from numpy import std
from pandas import read_csv
from sklearn.model_selection import cross_val_score
from sklearn.model_selection import RepeatedStratifiedKFold
from sklearn.neighbors import KNeighborsClassifier
from sklearn.preprocessing import LabelEncoder
from sklearn.preprocessing import PowerTransformer
from sklearn.preprocessing import MinMaxScaler
from sklearn.pipeline import Pipeline
# load dataset
dataset = read_csv('sonar.csv', header=None)
data = dataset.values
# separate into input and output columns
X, y = data[:, :-1], data[:, -1]
# ensure inputs are floats and output is an integer label
X = X.astype('float32')
y = LabelEncoder().fit_transform(y.astype('str'))
# define the pipeline
scaler = MinMaxScaler(feature_range=(1, 2))
power = PowerTransformer(method='box-cox')
model = KNeighborsClassifier()
pipeline = Pipeline(steps=[('s', scaler),('p', power), ('m', model)])
# evaluate the pipeline
cv = RepeatedStratifiedKFold(n_splits=10, n_repeats=3, random_state=1)
n_scores = cross_val_score(pipeline, X, y, scoring='accuracy', cv=cv, n_jobs=-1)
# report pipeline performance
print('Accuracy: %.3f (%.3f)' % (mean(n_scores), std(n_scores)))
Kết quả thực hiện:
Accuracy: 0.811 (0.085)
Độ chính xác đã tăng lên 1 chút, từ 79.7% lên thành 81.1%.
2.3 Yeo-Johnson transform
Yeo-Johnson transform cũng được đặt tên theo 2 tác giả của nó. Khác với Box-Cox là Yeo-Johnson không yêu cầu dữ liệu phải dương. Nó hỗ trợ cả giá trị âm và 0.
# visualize a yeo-johnson transform of the sonar dataset
from pandas import read_csv
from pandas import DataFrame
from sklearn.preprocessing import PowerTransformer
from matplotlib import pyplot
# Load dataset
dataset = read_csv('sonar.csv', header=None)
# retrieve just the numeric input values
data = dataset.values[:, :-1]
# perform a yeo-johnson transform of the dataset
pt = PowerTransformer(method='yeo-johnson')
data = pt.fit_transform(data)
# convert the array back to a dataframe
dataset = DataFrame(data)
# histograms of the variables
fig = dataset.hist(xlabelsize=4, ylabelsize=4)
[x.title.set_size(4) for x in fig.ravel()]
# show the plot
pyplot.show()
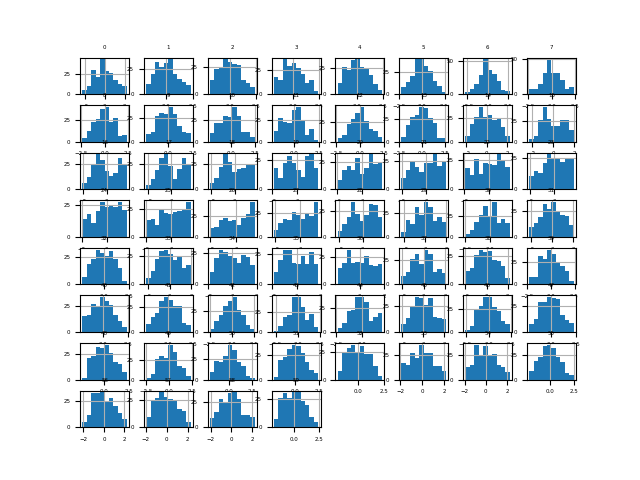
Giống như Box-Cox, phân phối của các features giống Gaussian hơn rất nhiều so với dữ liệu gốc ban đầu.
Mô hình hóa tập dữ liệu này sau khi thực hiện Power Transforms với thuật toán kNN:
# evaluate knn on the yeo-johnson sonar dataset
from numpy import mean
from numpy import std
from pandas import read_csv
from sklearn.model_selection import cross_val_score
from sklearn.model_selection import RepeatedStratifiedKFold
from sklearn.neighbors import KNeighborsClassifier
from sklearn.preprocessing import LabelEncoder
from sklearn.preprocessing import PowerTransformer
from sklearn.pipeline import Pipeline
# load dataset
dataset = read_csv('sonar.csv', header=None)
data = dataset.values
# separate into input and output columns
X, y = data[:, :-1], data[:, -1]
# ensure inputs are floats and output is an integer label
X = X.astype('float32')
y = LabelEncoder().fit_transform(y.astype('str'))
# define the pipeline
power = PowerTransformer(method='yeo-johnson')
model = KNeighborsClassifier()
pipeline = Pipeline(steps=[('p', power), ('m', model)])
# evaluate the pipeline
cv = RepeatedStratifiedKFold(n_splits=10, n_repeats=3, random_state=1)
n_scores = cross_val_score(pipeline, X, y, scoring='accuracy', cv=cv, n_jobs=-1)
# report pipeline performance
print('Accuracy: %.3f (%.3f)' % (mean(n_scores), std(n_scores)))
Kết quả thực hiện:
Accuracy: 0.808 (0.082)
Độ chính cũng đc cải thiện hơn một chút so với mốc 79.7% ban đầu, lên thành 80.8%.
Hãy nhớ lại bài trước, Standardization cũng giúp ta đưa dữ liệu về phân phối gần Gaussian. Thử kết hợp cả 2 kỹ thuật này xem sao.
# evaluate knn on the yeo-johnson standardized sonar dataset
from numpy import mean
from numpy import std
from pandas import read_csv
from sklearn.model_selection import cross_val_score
from sklearn.model_selection import RepeatedStratifiedKFold
from sklearn.neighbors import KNeighborsClassifier
from sklearn.preprocessing import LabelEncoder
from sklearn.preprocessing import PowerTransformer
from sklearn.preprocessing import StandardScaler
from sklearn.pipeline import Pipeline
# load dataset
dataset = read_csv('sonar.csv', header=None)
data = dataset.values
# separate into input and output columns
X, y = data[:, :-1], data[:, -1]
# ensure inputs are floats and output is an integer label
X = X.astype('float32')
y = LabelEncoder().fit_transform(y.astype('str'))
# define the pipeline
scaler = StandardScaler()
power = PowerTransformer(method='yeo-johnson')
model = KNeighborsClassifier()
pipeline = Pipeline(steps=[('s', scaler), ('p', power), ('m', model)])
# evaluate the pipeline
cv = RepeatedStratifiedKFold(n_splits=10, n_repeats=3, random_state=1)
n_scores = cross_val_score(pipeline, X, y, scoring='accuracy', cv=cv, n_jobs=-1)
# report pipeline performance
print('Accuracy: %.3f (%.3f)' % (mean(n_scores), std(n_scores)))
Kết quả thực hiện:
Accuracy: 0.816 (0.077)
Thật vui là độ chính xác đã tăng lên một chút, thành 81.6%.
3. Thực hành Quantile Transforms
3.1 Normal Quantile Transform
Áp dụng Normal Quantile Transform trên tập Sonar.
# visualize a normal quantile transform of the sonar dataset
from pandas import read_csv
from pandas import DataFrame
from sklearn.preprocessing import QuantileTransformer
from matplotlib import pyplot
# load dataset
dataset = read_csv('sonar.csv', header=None)
# retrieve just the numeric input values
data = dataset.values[:, :-1]
# perform a normal quantile transform of the dataset
trans = QuantileTransformer(n_quantiles=100, output_distribution='normal')
data = trans.fit_transform(data)
# convert the array back to a dataframe
dataset = DataFrame(data)
# histograms of the variables
fig = dataset.hist(xlabelsize=4, ylabelsize=4)
[x.title.set_size(4) for x in fig.ravel()]
# show the plot
pyplot.show()
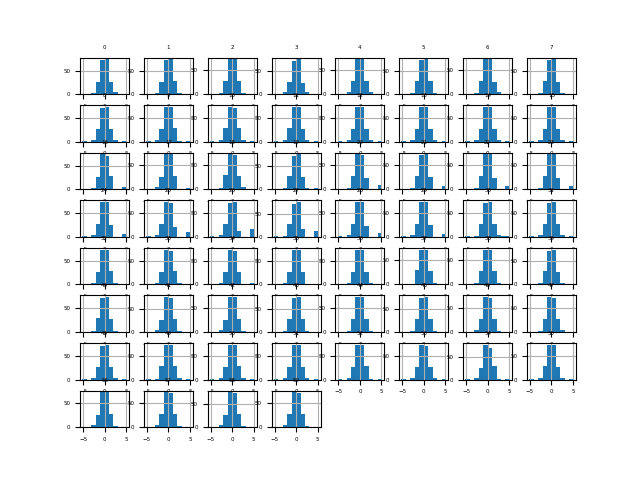
Phân phối của các features sau khi thực hiện Normal Quantile Transform đã giống Gaussian hơn rất nhiều.
Mô hình hóa tập dữ liệu với thuật toán kNN:
# evaluate knn on the sonar dataset with normal quantile transform
from numpy import mean
from numpy import std
from pandas import read_csv
from sklearn.model_selection import cross_val_score
from sklearn.model_selection import RepeatedStratifiedKFold
from sklearn.neighbors import KNeighborsClassifier
from sklearn.preprocessing import LabelEncoder
from sklearn.preprocessing import QuantileTransformer
from sklearn.pipeline import Pipeline
# load dataset
dataset = read_csv('sonar.csv', header=None)
data = dataset.values
# separate into input and output columns
X, y = data[:, :-1], data[:, -1]
# ensure inputs are floats and output is an integer label
X = X.astype('float32')
y = LabelEncoder().fit_transform(y.astype('str'))
# define the pipeline
trans = QuantileTransformer(n_quantiles=100, output_distribution='normal')
model = KNeighborsClassifier()
pipeline = Pipeline(steps=[('t', trans), ('m', model)])
# evaluate the pipeline
cv = RepeatedStratifiedKFold(n_splits=10, n_repeats=3, random_state=1)
n_scores = cross_val_score(pipeline, X, y, scoring='accuracy', cv=cv, n_jobs=-1)
# report pipeline performance
print('Accuracy: %.3f (%.3f)' % (mean(n_scores), std(n_scores)))
Kết quả thực hiện:
Accuracy: 0.817 (0.087)
Độ chính xác trong trường hợp này cao hơn tất cả các trường hợp của Power Transforms một chút.
3.2 Uniform Quantile Transform
Áp dụng Normal Quantile Transform trên tập Sonar.
# visualize a uniform quantile transform of the sonar dataset
from pandas import read_csv
from pandas import DataFrame
from sklearn.preprocessing import QuantileTransformer
from matplotlib import pyplot
# load dataset
dataset = read_csv('sonar.csv', header=None)
# retrieve just the numeric input values
data = dataset.values[:, :-1]
# perform a uniform quantile transform of the dataset
trans = QuantileTransformer(n_quantiles=100, output_distribution='uniform')
data = trans.fit_transform(data)
# convert the array back to a dataframe
dataset = DataFrame(data)
# histograms of the variables
fig = dataset.hist(xlabelsize=4, ylabelsize=4)
[x.title.set_size(4) for x in fig.ravel()]
# show the plot
pyplot.show()
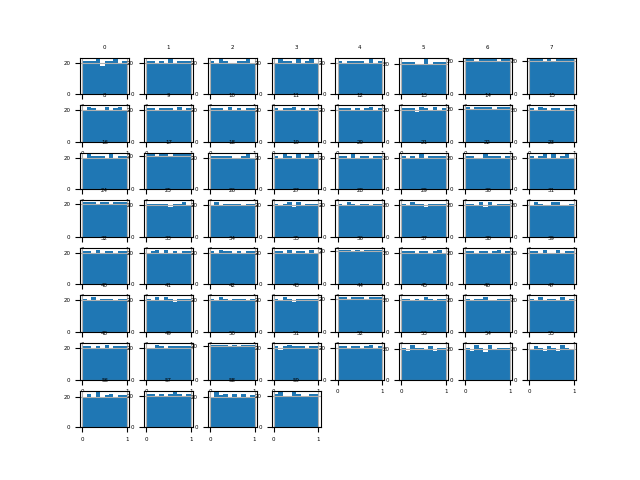
Ta thấy phân phối của các features gần như đồng nhất (uniform) sau khi thực hiện Uniform Quantile Transform.
Mô hình hóa tập dữ liệu với thuật toán kNN:
# evaluate knn on the sonar dataset with uniform quantile transform
from numpy import mean
from numpy import std
from pandas import read_csv
from sklearn.model_selection import cross_val_score
from sklearn.model_selection import RepeatedStratifiedKFold
from sklearn.neighbors import KNeighborsClassifier
from sklearn.preprocessing import LabelEncoder
from sklearn.preprocessing import QuantileTransformer
from sklearn.pipeline import Pipeline
# load dataset
dataset = read_csv('sonar.csv', header=None)
data = dataset.values
# separate into input and output columns
X, y = data[:, :-1], data[:, -1]
# ensure inputs are floats and output is an integer label
X = X.astype('float32')
y = LabelEncoder().fit_transform(y.astype('str'))
# define the pipeline
trans = QuantileTransformer(n_quantiles=100, output_distribution='uniform')
model = KNeighborsClassifier()
pipeline = Pipeline(steps=[('t', trans), ('m', model)])
# evaluate the pipeline
cv = RepeatedStratifiedKFold(n_splits=10, n_repeats=3, random_state=1)
n_scores = cross_val_score(pipeline, X, y, scoring='accuracy', cv=cv, n_jobs=-1)
# report pipeline performance
print('Accuracy: %.3f (%.3f)' % (mean(n_scores), std(n_scores)))
Kết quả thực hiện:
Accuracy: 0.845 (0.074)
Độ chính xác đã tăng lên khá nhiều so với các kỹ thuật transforms khác, lên đến 84.5%.
Đối với Uniform Quantile Transform thì n_quantiles là tham số có thể ảnh hưởng đến hiệu năng của model. Ta thử đi tune nó xem sao:
# explore number of quantiles on classification accuracy
from numpy import mean
from numpy import std
from pandas import read_csv
from sklearn.model_selection import cross_val_score
from sklearn.model_selection import RepeatedStratifiedKFold
from sklearn.neighbors import KNeighborsClassifier
from sklearn.preprocessing import QuantileTransformer
from sklearn.preprocessing import LabelEncoder
from sklearn.pipeline import Pipeline
from matplotlib import pyplot

# get the dataset
def get_dataset(filename):
	# load dataset
	dataset = read_csv(filename, header=None)
	data = dataset.values
	# separate into input and output columns
	X, y = data[:, :-1], data[:, -1]
	# ensure inputs are floats and output is an integer label
	X = X.astype('float32')
	y = LabelEncoder().fit_transform(y.astype('str'))
	return X, y

# get a list of models to evaluate
def get_models():
	models = dict()
	for i in range(1,100):
		# define the pipeline
		trans = QuantileTransformer(n_quantiles=i, output_distribution='uniform')
		model = KNeighborsClassifier()
		models[str(i)] = Pipeline(steps=[('t', trans), ('m', model)])
	return models

# evaluate a given model using cross-validation
def evaluate_model(model, X, y):
	cv = RepeatedStratifiedKFold(n_splits=10, n_repeats=3, random_state=1)
	scores = cross_val_score(model, X, y, scoring='accuracy', cv=cv, n_jobs=-1)
	return scores

# define dataset
X, y = get_dataset('sonar.csv')
# get the models to evaluate
models = get_models()
# evaluate the models and store results
results = list()
for name, model in models.items():
	scores = evaluate_model(model, X, y)
	results.append(mean(scores))
	print('>%s %.3f (%.3f)' % (name, mean(scores), std(scores)))
# plot model performance for comparison
pyplot.plot(results)
pyplot.show()
Kết quả thực hiện:
>1 0.534 (0.016)
>2 0.813 (0.085)
>3 0.840 (0.080)
>4 0.854 (0.075)
>5 0.848 (0.072)
...
>95 0.843 (0.074)
>96 0.845 (0.074)
>97 0.846 (0.073)
>98 0.843 (0.073)
>99 0.846 (0.075)
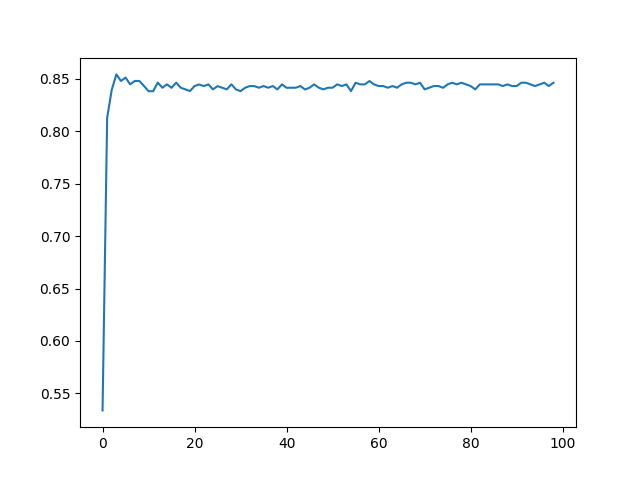
84,6% là kết quả tốt nhất đạt được khi n_quantiles=100.
4. Kết luận
Bài thứ 3 về chủ đề Data Transforms, mình đã giới thiệu 4 kỹ thuật thực hiện Data Transforms để làm cho dữ liệu có phân phối gần với Gaussian hơn là Box-Cox, Yeo-Johnson, Normal Quantile, Uniform Quantile, từ đó nâng cao hiệu năng của model. Toàn bộ code của bài này, các bạn có thể tham khảo tại đây.
Bài tiếp theo chúng ta sẽ tìm hiểu cách thức thực hiện Data Transforms để chuyển đổi features từ numerical sang categorical. Mời các bạn đón đọc.
5. Tham khảo
[1] Jason Brownlee, “Data Preparation for Machine Learning”, Book: https://machinelearningmastery.com/data-preparation-for-machine-learning/.