DP4ML - Data Transform - Phần 1 - How to Scale Numerical Data

Bài thứ 14 trong chuỗi các bài viết về chủ đề Data Preparation cho các mô hình ML và là bài đầu tiên về về Data Transforms. Trong bài này, chúng ta sẽ tìm hiểu về các kiến thức cơ bản của Data Transforms, các kỹ thuật thực hiện Transforms cho features dạng numerical. Chúng ta cũng sẽ thực hành trên bộ dữ liệu thực tế.
1. Data Transforms
Trong một bộ dữ liệu, pham vi giá trị, sự phân phối, đơn vị đo, … của các features có thể khác nhau, tùy theo từng bài toán cụ thể. Những sự khác biệt này làm tăng độ khó của vấn đề đang được mô hình hóa, hoặc tệ hơn là làm cho mô hình trở nên thiên vị hơn đối với những features có khoảng giá trị lớn hơn, có phân phối lớn hơn, … Đó là điều mà chúng ta hoàn toàn không mong muốn. Để hạn chế vấn đề này, dữ liệu cần phải được transform trước khi đưa vào để huấn luyện mô hình.
Hai kỹ thuật phổ biến nhất để thực hiện transform đối với dữ liệu dạng numerical là Normalization và Standardization. Normalization chuyển đổi phạm vi giá trị của tất cả các features về từ 0 đến 1. Còn Standardization chuyển đổi phân phối của tất cả các features về phân phối chuẩn (là phân phối mà có giá trị trung bình mean = 0, và độ lệch chuẩn std = 1). Chúng ta sẽ tìm hiểu kỹ hơn về 2 kỹ thuật này trong các phần tiếp theo.
Việc thực hiện Data Transform áp dụng cho cả features và target.
2. Numerical Data Scaling Methods
2.1 Data Normalization
Công thức tính giá trị của feature khi thực hiện normalized như sau:
$y = \frac{x- min}{max - min}$
Trong đó:
- x là giá trị ban đầu của feature.
- y là giá trị sau khi normalized của feature.
- min/max là giá trị lớn nhất/nhỏ nhất của feature trong toàn bộ tập dữ liệu.
Thư viện scikit-learn cung cấp lớp MinMaxScaler() giúp chúng ta thực hiện công việc này một cách đơn giản. Các bước thực hiện như sau:
- Khai báo một instance của lớp MinMaxScaler().
- Fit instance vừa tạo trên tập train (thực chất là tìm giá trị max/min của mỗi features trong tập train) sưr dụng hàm fit().
- Áp dụng instance đã fit lên tập train/test, và các mẫu dữ liệu mới về sau, sử dụng hàm transforms().
Hai hàm fit() và transform() có thể gộp chung thành hàm fit_transform() nếu chúng ta chỉ có 1 tập dữ liệu cần xử lý (VD: chỉ có tập train, …)
Mặc định MinMaxScaler() sẽ đưa giá trị của features về khoảng [0,1], tuy nhiên, chúng ta có thể chỉ định một khoảng giá trị mong muốn khác thông qua tham số feature_range.
Ví dụ sử dụng MinMaxScaler() để thực hiện normalization:
# example of a normalization
from numpy import asarray
from sklearn.preprocessing import MinMaxScaler
# define data
data = asarray([[100, 0.001],
				[8, 0.05],
				[50, 0.005],
				[88, 0.07],
				[4, 0.1]])
print(data)
# define min max scaler
scaler = MinMaxScaler()
# transform data
scaled = scaler.fit_transform(data)
print(scaled)
Kết quả thực hiện:
[[1.0e+02 1.0e-03]
 [8.0e+00 5.0e-02]
 [5.0e+01 5.0e-03]
 [8.8e+01 7.0e-02]
 [4.0e+00 1.0e-01]]
[[1.         0.        ]
 [0.04166667 0.49494949]
 [0.47916667 0.04040404]
 [0.875      0.6969697 ]
 [0.         1.        ]]
Rõ ràng là các giá trị bay giờ đều nằm trong khoảng [0,1]. Giá trị min trở thành 0, còn giá trị max trở thành 1.
Ở chiều ngược lại, chúng ta có thể chuyển đổi ngược các giá trị đã được normalized về lại giá trị ban đâu bằng cách sử dụng hàm inverse_transform() của lớp MinMaxScaler(). Việc này hữu ích khi chúng ta muốn tìm lại chính xác kết quả dự đoán của model, bởi vì kết quả trả về từ model là giá trị đã được normalized, mà chúng ta muốn biết giá trị khi chưa thực hiện normalize của nó.
2.2 Data Standardization
Công thức tính giá trị của feature khi thực hiện standardized như sau:
$y = \frac{x- mean}{std}$
Trong đó:
-
x là giá trị ban đầu của feature.
-
y là giá trị sau khi standardized feature.
-
mean là giá trị trung bình của feature.
$y = \frac{1}{N} \sum _{i=1}^n x_i$
-
std là giá trị độ lệch chuẩn feature.
$y = \sqrt{\frac{\sum_{i=1}^n(x_i-mean)^2}{N - 1}}$
Scikit-learn cung cấp lớp StandardScaler() để thực hiện hiện standardization. Cách sử dụng hoàn toàn tương tự như lớp MinMaxScaler().
Ví dụ:
# example of a standardization
from numpy import asarray
from sklearn.preprocessing import StandardScaler
# define data
data = asarray([[100, 0.001],
				[8, 0.05],
				[50, 0.005],
				[88, 0.07],
				[4, 0.1]])
print(data)
# define standard scaler
scaler = StandardScaler()
# transform data
scaled = scaler.fit_transform(data)
print(scaled)
Kết quả thực hiện:
[[1.0e+02 1.0e-03]
 [8.0e+00 5.0e-02]
 [5.0e+01 5.0e-03]
 [8.8e+01 7.0e-02]
 [4.0e+00 1.0e-01]]
[[ 1.26398112 -1.16389967]
 [-1.06174414  0.12639634]
 [ 0.         -1.05856939]
 [ 0.96062565  0.65304778]
 [-1.16286263  1.44302493]]
3. Thực hành các kỹ thuật Data Transforms
3.1 Diebetes Dataset
Chúng ta tiếp tục sử dụng bộ dữ liệu Diabetes đã được giới thiệu ở bài thứ 4.
Đầu tiên, hãy load bộ dữ liệu này lên:
# load and summarize the diabetes dataset
from pandas import read_csv
from matplotlib import pyplot
# load the dataset
dataset = read_csv('pima-indians-diabetes.csv', header=None)
# summarize the shape of the dataset
print(dataset.shape)
# summarize each variable
print(dataset.describe())
# histograms of the variables
fig = dataset.hist(xlabelsize=4, ylabelsize=4)
[x.title.set_size(4) for x in fig.ravel()]
# show the plot
pyplot.show()
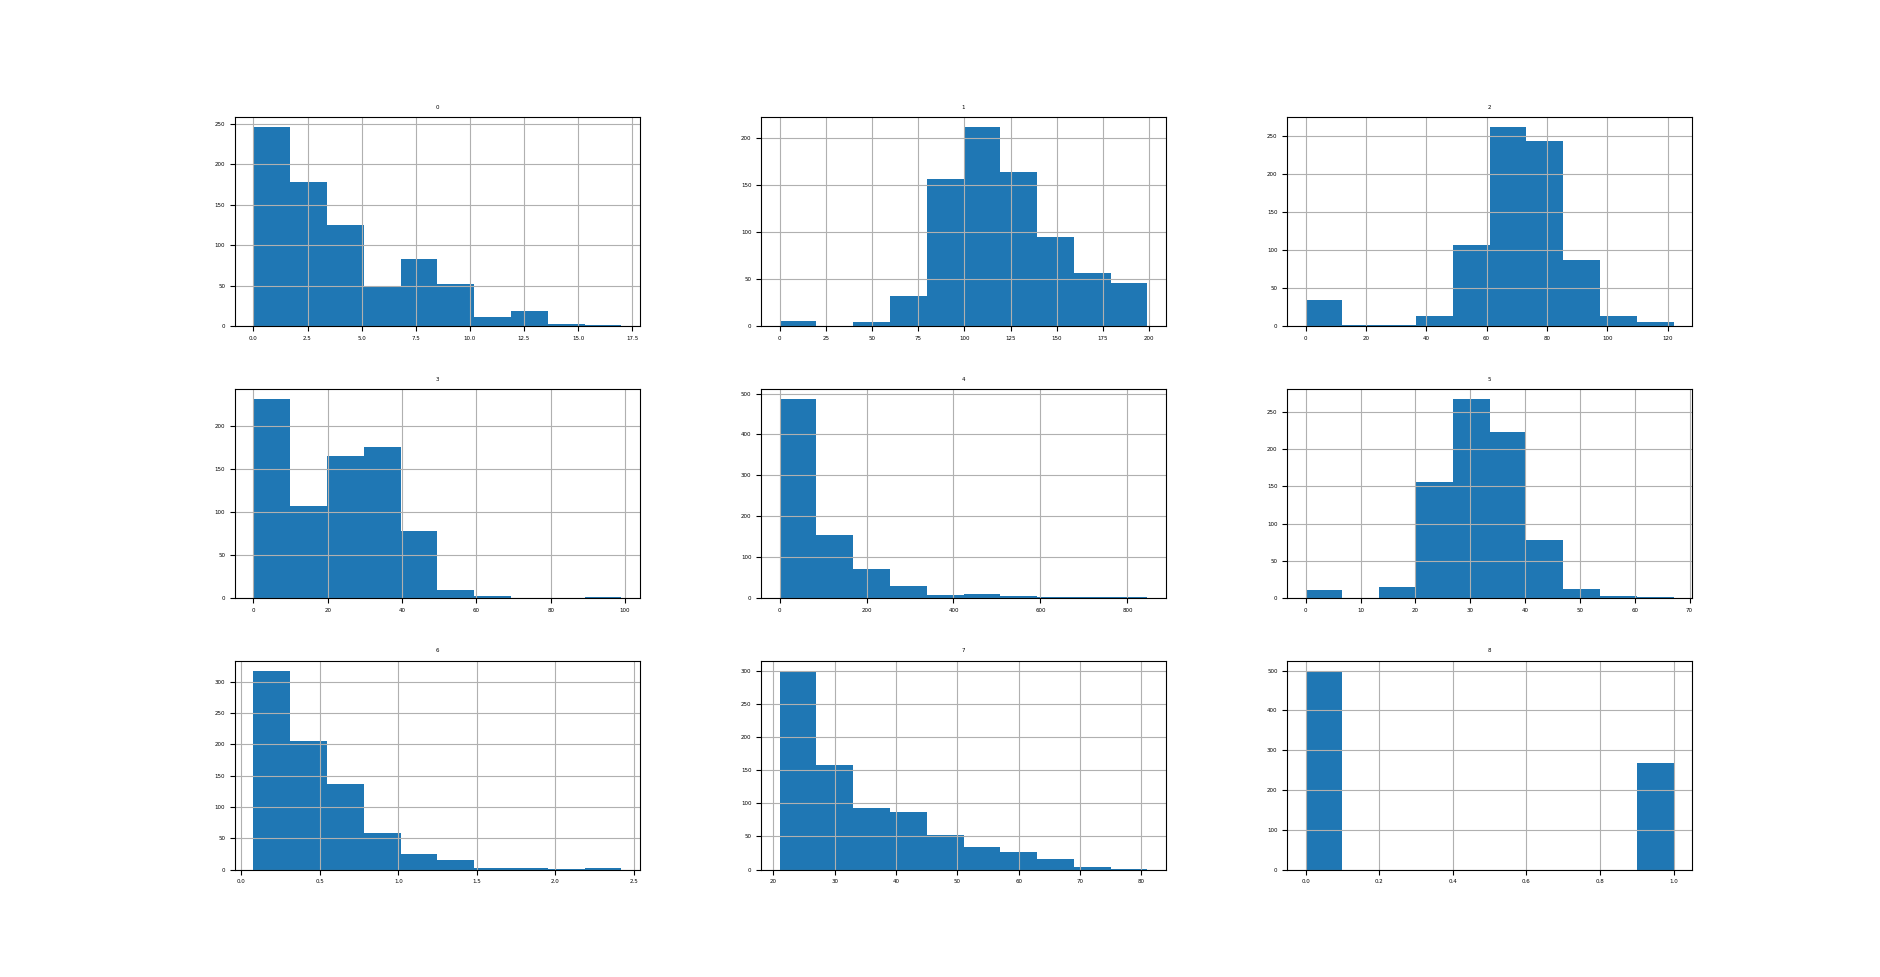
Kết quả thực hiện:
(768, 9)
                0           1           2           3           4           5           6           7           8
count  768.000000  768.000000  768.000000  768.000000  768.000000  768.000000  768.000000  768.000000  768.000000
mean     3.845052  120.894531   69.105469   20.536458   79.799479   31.992578    0.471876   33.240885    0.348958
std      3.369578   31.972618   19.355807   15.952218  115.244002    7.884160    0.331329   11.760232    0.476951
min      0.000000    0.000000    0.000000    0.000000    0.000000    0.000000    0.078000   21.000000    0.000000
25%      1.000000   99.000000   62.000000    0.000000    0.000000   27.300000    0.243750   24.000000    0.000000
50%      3.000000  117.000000   72.000000   23.000000   30.500000   32.000000    0.372500   29.000000    0.000000
75%      6.000000  140.250000   80.000000   32.000000  127.250000   36.600000    0.626250   41.000000    1.000000
max     17.000000  199.000000  122.000000   99.000000  846.000000   67.100000    2.420000   81.000000    1.000000

Ta thấy, các features đang có khoảng giá trị và phân phối khác xa nhau.
Tiếp theo, tạo Base model với dữ liệu được giữ nguyên như ban đầu. Ở đây, mình lựa chọn thuật toán KNN cho đơn giản.
# evaluate knn on the raw diabetes dataset
from numpy import mean
from numpy import std
from pandas import read_csv
from sklearn.model_selection import cross_val_score
from sklearn.model_selection import RepeatedStratifiedKFold
from sklearn.neighbors import KNeighborsClassifier
from sklearn.preprocessing import LabelEncoder
# load the dataset
dataset = read_csv('pima-indians-diabetes.csv', header=None)
data = dataset.values
# separate into input and output columns
X, y = data[:, :-1], data[:, -1]
# ensure inputs are floats and output is an integer label
X = X.astype('float32')
y = LabelEncoder().fit_transform(y.astype('str'))
# define and configure the model
model = KNeighborsClassifier()
# evaluate the model
cv = RepeatedStratifiedKFold(n_splits=10, n_repeats=3, random_state=1)
n_scores = cross_val_score(model, X, y, scoring='accuracy', cv=cv, n_jobs=-1)
# report model performance
print('Accuracy: %.3f (%.3f)' % (mean(n_scores), std(n_scores)))
Kết quả thực hiện:
Accuracy: 0.717 (0.040)
Base model cho ta độ chính xác là 71.7%. Hãy thử xem giá trị này có tăng lên khi áp dụng 2 kỹ thuật Data Transforms hay không?
3.2 Normalization Data
Áp dụng kỹ thuật normalization trên tập Diebetes.
# visualize a minmax scaler transform of the diabetes dataset
from pandas import read_csv
from pandas import DataFrame
from sklearn.preprocessing import MinMaxScaler
from matplotlib import pyplot
# load the dataset
dataset = read_csv('pima-indians-diabetes.csv', header=None)
# retrieve just the numeric input values
data = dataset.values[:, :-1]
# perform a robust scaler transform of the dataset
trans = MinMaxScaler()
data = trans.fit_transform(data)
# convert the array back to a dataframe
dataset = DataFrame(data)
# summarize
print(dataset.describe())
# histograms of the variables
fig = dataset.hist(xlabelsize=4, ylabelsize=4)
[x.title.set_size(4) for x in fig.ravel()]
# show the plot
pyplot.show()
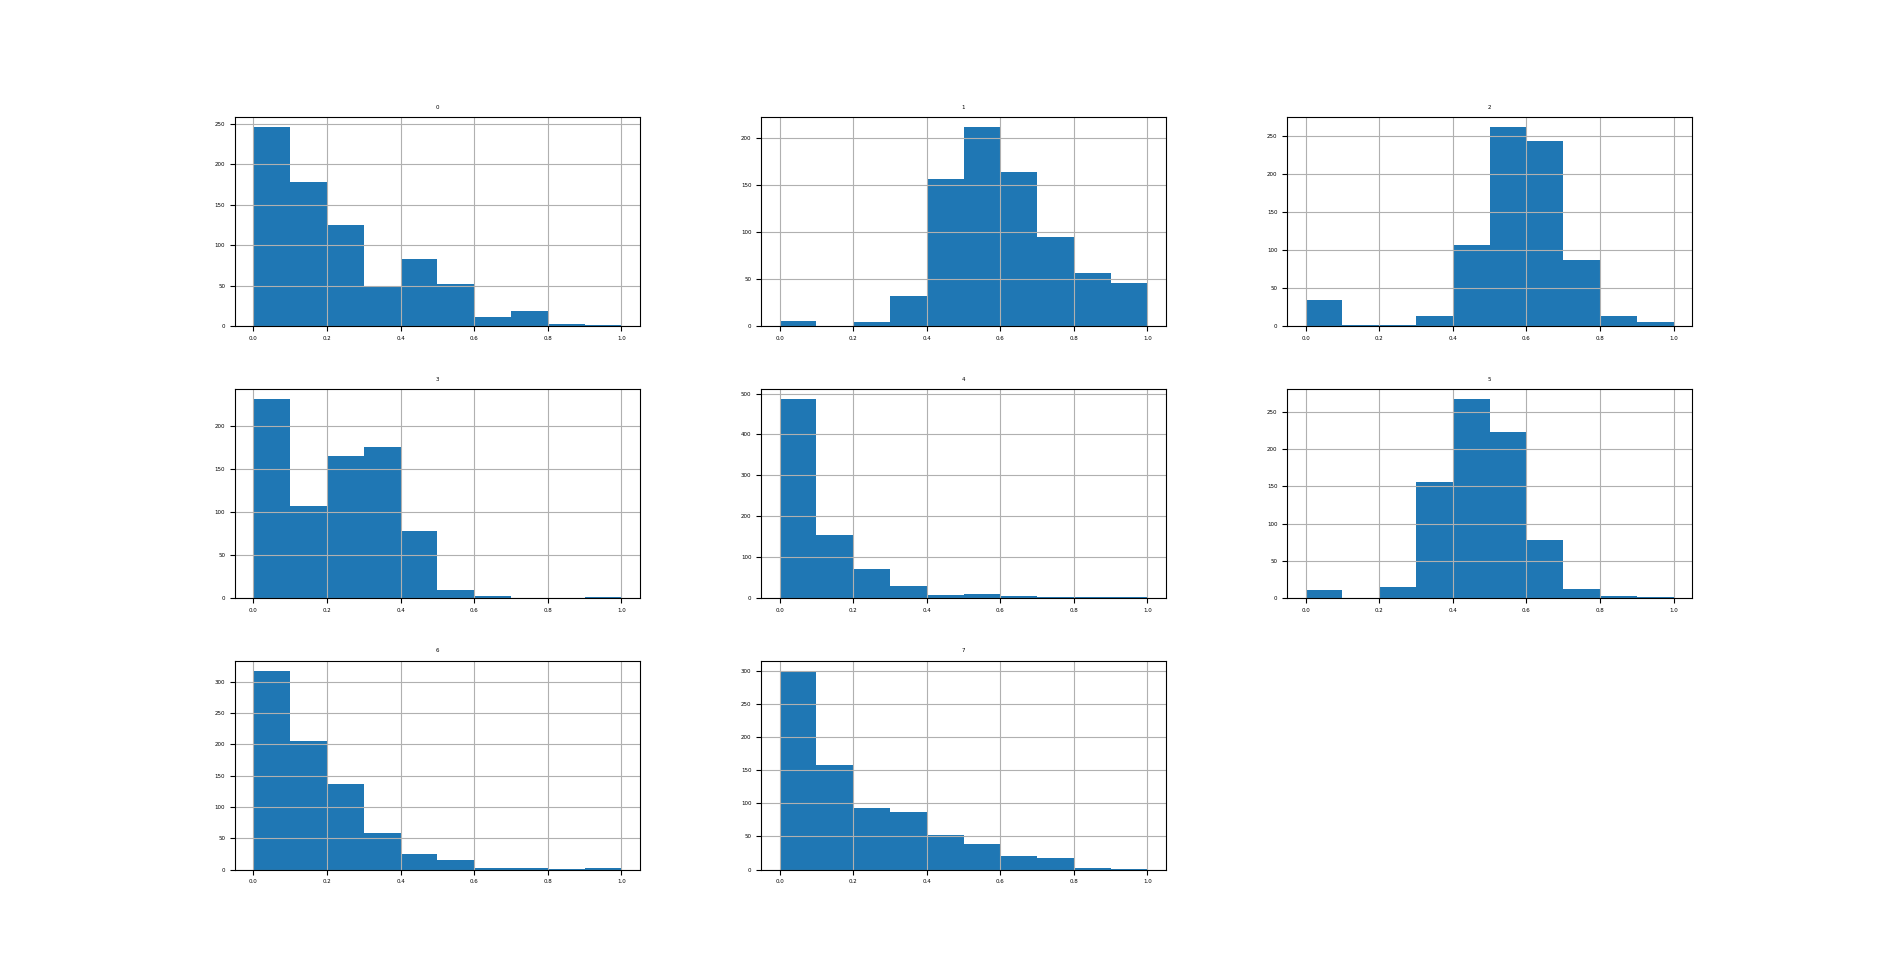
Kết quả thực hiện:
                0           1           2           3           4           5           6           7
count  768.000000  768.000000  768.000000  768.000000  768.000000  768.000000  768.000000  768.000000
mean     0.226180    0.607510    0.566438    0.207439    0.094326    0.476790    0.168179    0.204015
std      0.198210    0.160666    0.158654    0.161134    0.136222    0.117499    0.141473    0.196004
min      0.000000    0.000000    0.000000    0.000000    0.000000    0.000000    0.000000    0.000000
25%      0.058824    0.497487    0.508197    0.000000    0.000000    0.406855    0.070773    0.050000
50%      0.176471    0.587940    0.590164    0.232323    0.036052    0.476900    0.125747    0.133333
75%      0.352941    0.704774    0.655738    0.323232    0.150414    0.545455    0.234095    0.333333
max      1.000000    1.000000    1.000000    1.000000    1.000000    1.000000    1.000000    1.000000

Rõ ràng rằng tất các các features đều có giá trị nằm trong khoảng [0,1].
Thử đánh giá mô hình kNN trên tập Diebetes đã được normalized:
# visualize a standard scaler transform of the diabetes dataset
# evaluate knn on the diabetes dataset with minmax scaler transform
from numpy import mean
from numpy import std
from pandas import read_csv
from sklearn.model_selection import cross_val_score
from sklearn.model_selection import RepeatedStratifiedKFold
from sklearn.neighbors import KNeighborsClassifier
from sklearn.preprocessing import LabelEncoder
from sklearn.preprocessing import MinMaxScaler
from sklearn.pipeline import Pipeline
# load the dataset
dataset = read_csv('pima-indians-diabetes.csv', header=None)
data = dataset.values
# separate into input and output columns
X, y = data[:, :-1], data[:, -1]
# ensure inputs are floats and output is an integer label
X = X.astype('float32')
y = LabelEncoder().fit_transform(y.astype('str'))
# define the pipeline
trans = MinMaxScaler()
model = KNeighborsClassifier()
pipeline = Pipeline(steps=[('t', trans), ('m', model)])
# evaluate the pipeline
cv = RepeatedStratifiedKFold(n_splits=10, n_repeats=3, random_state=1)
n_scores = cross_val_score(pipeline, X, y, scoring='accuracy', cv=cv, n_jobs=-1)
# report pipeline performance
print('Accuracy: %.3f (%.3f)' % (mean(n_scores), std(n_scores)))
Kết quả thực hiện:
Accuracy: 0.739 (0.053)
Độ chính xác tăng từ 71.7% lên gần 74%. Một sự cải thiện đáng kể.
3.3 Standardization Data
Áp dụng kỹ thuật standardization trên tập Diebetes:
# visualize a standard scaler transform of the diabetes dataset
from pandas import read_csv
from pandas import DataFrame
from sklearn.preprocessing import StandardScaler
from matplotlib import pyplot
# load the dataset
dataset = read_csv('pima-indians-diabetes.csv', header=None)
# retrieve just the numeric input values
data = dataset.values[:, :-1]
# perform a robust scaler transform of the dataset
trans = StandardScaler()
data = trans.fit_transform(data)
# convert the array back to a dataframe
dataset = DataFrame(data)
# summarize
print(dataset.describe())
# histograms of the variables
fig = dataset.hist(xlabelsize=4, ylabelsize=4)
[x.title.set_size(4) for x in fig.ravel()]
# show the plot
pyplot.show()
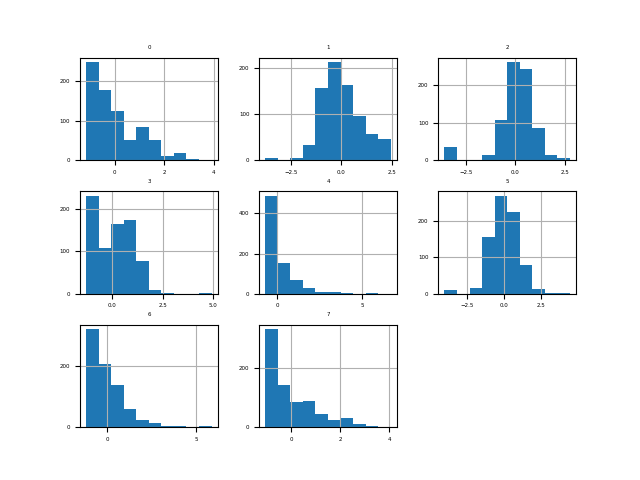
Kết quả thực hiện:
                  0             1             2             3             4             5             6             7
count  7.680000e+02  7.680000e+02  7.680000e+02  7.680000e+02  7.680000e+02  7.680000e+02  7.680000e+02  7.680000e+02
mean  -6.476301e-17 -9.251859e-18  1.503427e-17  1.006140e-16 -3.006854e-17  2.590520e-16  2.451743e-16  1.931325e-16
std    1.000652e+00  1.000652e+00  1.000652e+00  1.000652e+00  1.000652e+00  1.000652e+00  1.000652e+00  1.000652e+00
min   -1.141852e+00 -3.783654e+00 -3.572597e+00 -1.288212e+00 -6.928906e-01 -4.060474e+00 -1.189553e+00 -1.041549e+00
25%   -8.448851e-01 -6.852363e-01 -3.673367e-01 -1.288212e+00 -6.928906e-01 -5.955785e-01 -6.889685e-01 -7.862862e-01
50%   -2.509521e-01 -1.218877e-01  1.496408e-01  1.545332e-01 -4.280622e-01  9.419788e-04 -3.001282e-01 -3.608474e-01
75%    6.399473e-01  6.057709e-01  5.632228e-01  7.190857e-01  4.120079e-01  5.847705e-01  4.662269e-01  6.602056e-01
max    3.906578e+00  2.444478e+00  2.734528e+00  4.921866e+00  6.652839e+00  4.455807e+00  5.883565e+00  4.063716e+00

Biểu đồ histogram của các features được tạo, mặc dù các phân phối trông không khác nhiều so với các phân phối của dữ liệu ban đầu, ngoại trừ tỷ lệ của chúng trên trục x, nhưng chúng ta có thể thấy rằng trung tâm của mỗi phân phối đều tập trung vào điểm giá trị 0.
Thử đánh giá mô hình kNN trên tập Diebetes đã được standardized:
# evaluate knn on the diabetes dataset with standard scaler transform
from numpy import mean
from numpy import std
from pandas import read_csv
from sklearn.model_selection import cross_val_score
from sklearn.model_selection import RepeatedStratifiedKFold
from sklearn.neighbors import KNeighborsClassifier
from sklearn.preprocessing import LabelEncoder
from sklearn.preprocessing import StandardScaler
from sklearn.pipeline import Pipeline
# load the dataset
dataset = read_csv('pima-indians-diabetes.csv', header=None)
data = dataset.values
# separate into input and output columns
X, y = data[:, :-1], data[:, -1]
# ensure inputs are floats and output is an integer label
X = X.astype('float32')
y = LabelEncoder().fit_transform(y.astype('str'))
# define the pipeline
trans = StandardScaler()
model = KNeighborsClassifier()
pipeline = Pipeline(steps=[('t', trans), ('m', model)])
# evaluate the pipeline
cv = RepeatedStratifiedKFold(n_splits=10, n_repeats=3, random_state=1)
n_scores = cross_val_score(pipeline, X, y, scoring='accuracy', cv=cv, n_jobs=-1)
# report pipeline performance
print('Accuracy: %.3f (%.3f)' % (mean(n_scores), std(n_scores)))
Kết quả thực hiện:
Accuracy: 0.741 (0.050)
Độ chính xác tăng lên một chút so với khi thực hiện normalization, từ 73.9% lên 74.1%.
4. Common Questions
Q1: Khi nào thì nên sử dụng Normalization/Standardization?
Ưu tiên lựa chọn theo thứ tự sau:
- Nếu dữ liệu của bạn có phân phối chuẩn hoặc gần chuẩn, thì nên áp dụng Standardization.
- Nếu dữ liệu của bạn có số lượng lớn các features, phạm vi giá trị của các features đó khác nhau nhiều (10s, 100s, 1000s, 0.01, 0.001, …) thì nên sử dụng Normalization.
- Thử cả 2 kỹ thuật nếu bạn có đủ thời gian.
- Nếu dữ liệu của bạn không giống 3 trường hợp mô tả ở trên thì không cần thiết phải thực hiện Data Transforms.
Q2: Có nên thực hiện Standardization trước, sau đó lại thực hiện Normalization không?
Việc kết hợp cả 2 kỹ thuật Data Transforms có thể là một ý tưởng tốt. Hãy thử nó nếu bạn có đủ thời gian.
5. Kết luận
Bài đầu tiên về chủ đề Data Transforms, mình đã giới thiệu 2 kỹ thuật thực hiện Data Transforms cho dữ liệu dạng numerical, đó là normalization và standardizaton. Toàn bộ code của bài này, các bạn có thể tham khảo tại đây.
Bài tiếp theo chúng ta sẽ tìm hiểu cách thức thực hiện Data Transforms đối với dữ liệu có dạng categorical. Mời các bạn đón đọc.
6. Tham khảo
[1] Jason Brownlee, “Data Preparation for Machine Learning”, Book: https://machinelearningmastery.com/data-preparation-for-machine-learning/.